

What is Netdata
Getting real-time statistics on various system metrics is a top priority for system administrators, developers, and teams in general. This helps in real-time monitoring of systems and quickly identifies faults or errors and resolves them to ensure everything is back in working order.
Netdata is a free and open source real-time monitoring application that runs on a variety of computing devices; physical servers, cloud servers, containers, and even IoT devices. It collects a large amount of data and visualizes it on smooth and interactive information graphs. We will install Netdata on Ubuntu 20.04 and then we will demonstrate how various chart metrics are visualized.
How to install Netdata
This is the preferred way to install Netdata because it allows other arguments to be passed to the same command to customize the installation process. Most importantly, this method works seamlessly on all Linux distributions.
We go to the server and execute the command:
bash <(curl -Ss https://my-netdata.io/kickstart.sh)
To make it possible for us to download the script, we must also install “curl” if we do not have it already installed:
Debian/Ubuntu: apt install curl
CentOS/RHEL: yum install curl

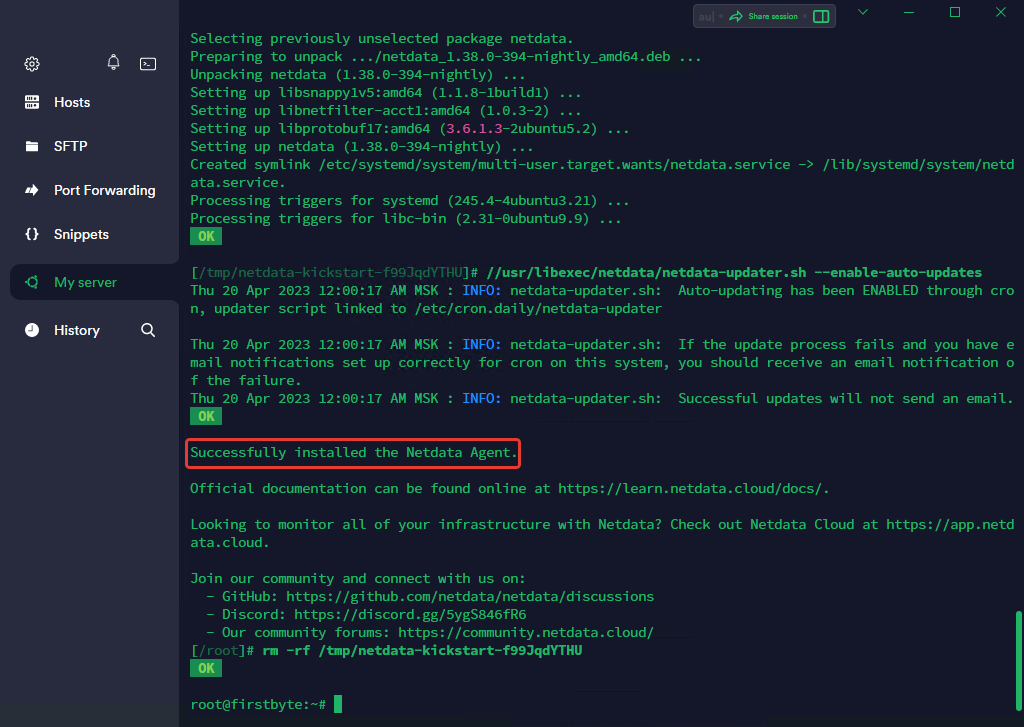
After we have accepted which all packages will be installed, we accept it again and then we get this result.
It will inform you that Netdata has been successfully installed and started.
We now need to secure our Netdata installation.
Как защитить Netdata
As you may have noticed, while Netdata does not have an HTTP authorization function, we will do it ourselves.
Now we need to make sure that Netdata is only listening on 127.0.0.1, as we don’t want the web interface to be available all over the internet.
We execute the command, open the files and make changes on the line “bind to“
nano /etc/netdata/netdata.conf
To look exactly like this (bind to = 127.0.0.1):

Then we need to install NGINX and apache2-utils in order to set up HTTP authorization.
To install, run the command:
Debian/Ubuntu: apt install nginx apache2-utils
CentOS/RHEL: yum install nginx apache2-utils

After installation, create a user for HTTP authorization and specify a password using the command:
htpasswd -c /etc/nginx/.htpasswd netdata
Now we make changes to the NGINX config file:
nano /etc/nginx/nginx.conf
In the opened file, in the http block, add the following:
(You need to specify the IP of the domain and the domain if any)
upstream backend {
   server 127.0.0.1:19999;
   keepalive 64;
}

server {
   listen Your-IP-srver-address:80;
   server_name mydomain.com;

   auth_basic "Protected";
   auth_basic_user_file /etc/nginx/.htpasswd;

   location / {
     proxy_set_header X-Forwarded-Host $host;
     proxy_set_header X-Forwarded-Server $host;
     proxy_set_header X-Forwarded-For $proxy_add_x_forwarded_for;
     proxy_pass http://backend;
     proxy_http_version 1.1;
     proxy_pass_request_headers on;
     proxy_set_header Connection "keep-alive";
     proxy_store off;
   }
}
After we have made the changes, we save the file and check if everything is fine with the NGINX configuration using the command:
nginx -tIf there were no errors and everything is fine with the configuration, restart the NGINX service with the command:
systemctl reload nginxAfter we have protected Netdata, we open our monitoring using the link:
http://IP-ADDRES/
The Netdata dashboard will appear with elegant and beautiful visualizations displaying a system overview of key system metrics such as CPU usage, network bandwidth statistics, disk read/write and RAM usage.

Conclusion
Netdata provides a great solution for monitoring your individual server in real time. You can set up alarms and notifications that can be triggered when a certain event or threshold is exceeded. The monitoring itself is very objective and you can easily work with it, pause and see who and what loaded your system at a certain time.
Try Netdata and let us know about your experience.