

Why you need to check the network load
If we just want to check the current network load on the server, it is important for us to know how to do it. If we see the load in the control panel or monitoring graphs and want to make sure whether it really exists or not. There may be many more reasons. Including from a security point of view, to understand what kind of traffic the server generates, whether everything is working properly. In this guide, we will talk about several tools.
How to check network load with nload
First we have to connect to our server and install a software called “nload”
Debian/Ubuntu: apt install nload
CentOS/RHEL: yum -y install nload
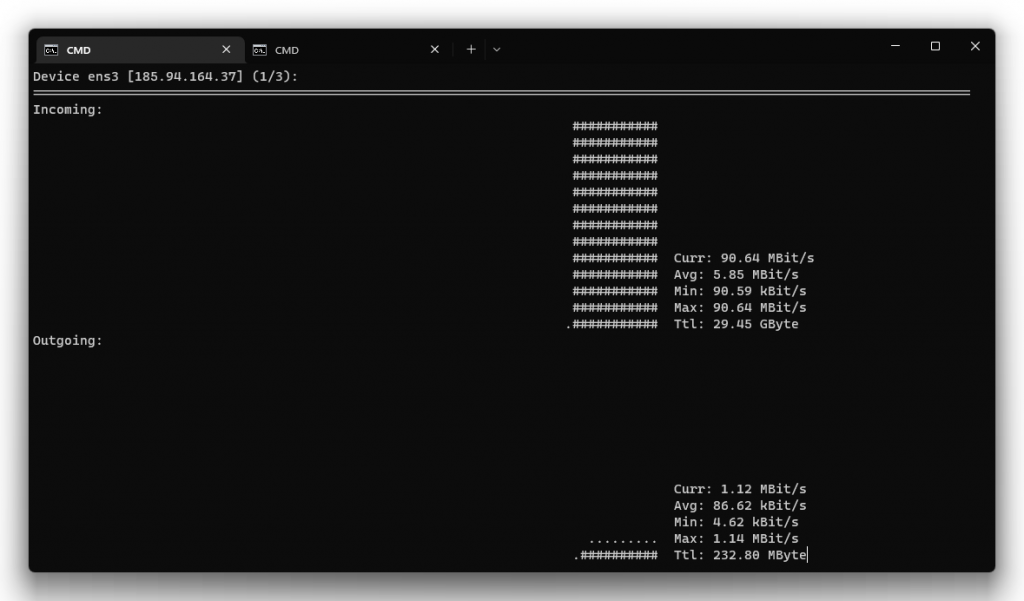
Once installed, we open it with the command “nload”
As you can see, for the test, we started downloading a test file and the “current” incoming speed immediately increased – i.e. in “Incoming” and “Outgoing” you can see the current load on incoming and outgoing traffic.
You can also see how much traffic was used on your server – “ttl”.
How to check network load with iftop
To install “iftop” we must run this command
Debian/Ubuntu: apt install iftop
CentOS/RHEL: yum -y install iftop
After installation, we run the program with the command “iftop”
The difference between “nload” and “iftop” is that in “iftop” you can see with what addresses your server “talks” to and how much traffic it receives from a particular address and how much traffic it sends to the same address.
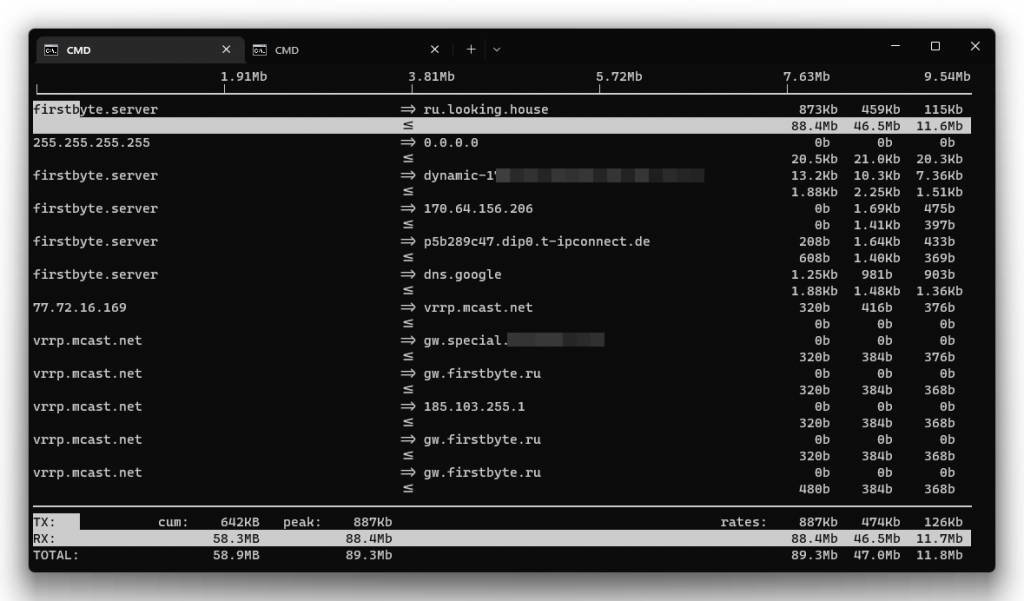
At the bottom of “iftop”, as in “nload”, you can see the current network load, incoming and outgoing traffic.
Other useful commands for checking network traffic are also: tcpdump, trafshow, iptraf
How to check network load using iptraf
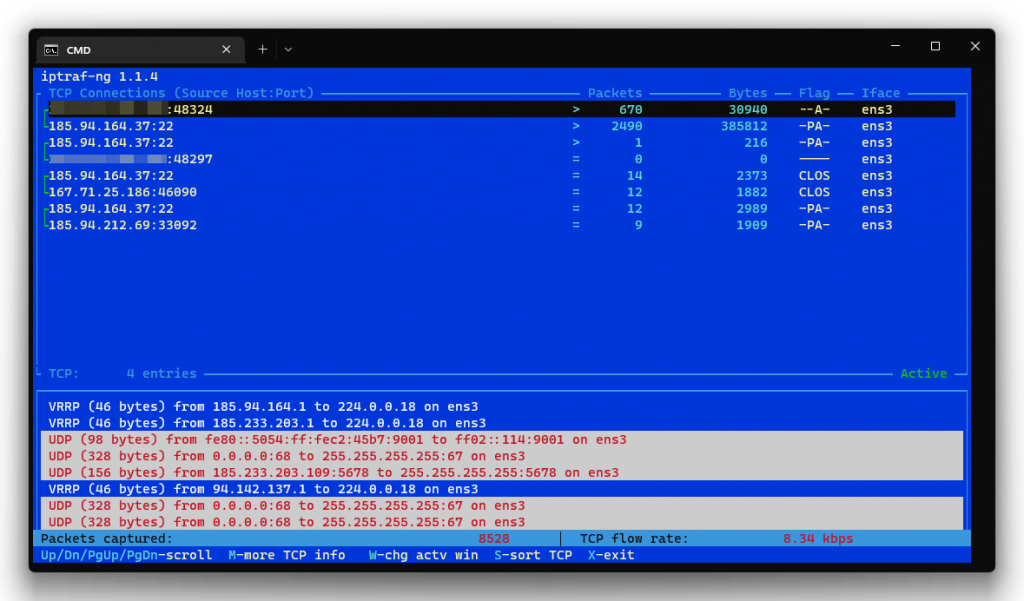
iptraf is a console-based network statistics utility for Linux. iptraf recognizes various protocols including IP, TCP, UDP, ICMP, IGMP, IGP, IGRP, OSPF, ARP, and RARP.
To install “iptraf” we must run this command
Debian/Ubuntu: apt-get install iptraf -y
CentOS/RHEL: yum install iptraf
To run “iptraf”, execute command
iptraf-ng
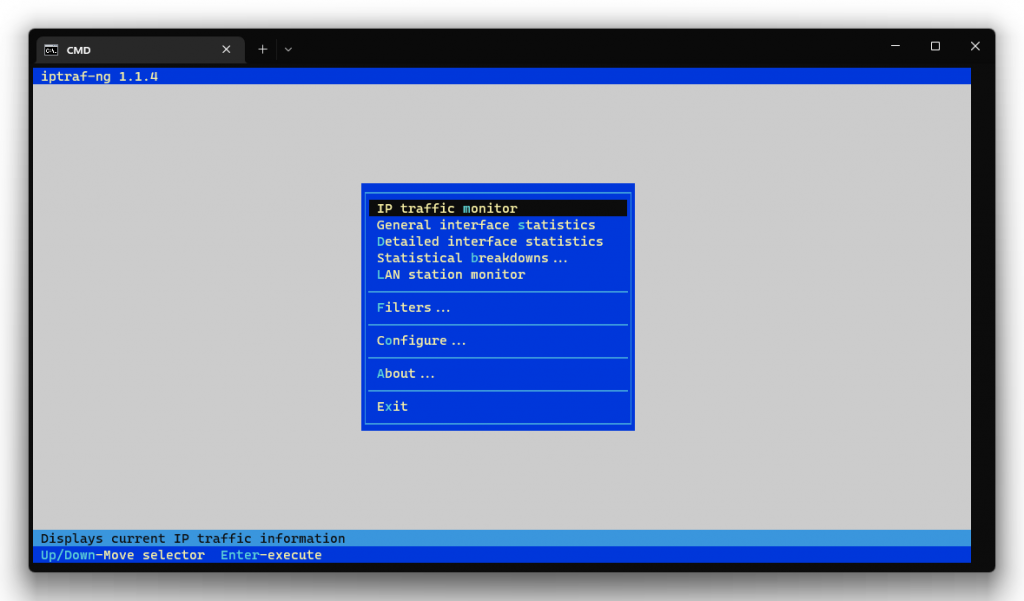
If we want to monitor traffic, select “IP traffic monitor”
If we want to see regular statistics on the network interface, select the item “General interface statistics”
If we want to see the statistics with more details, in this case, select the item “Detailed interface statistic”
Select the desired item, and then the network interface
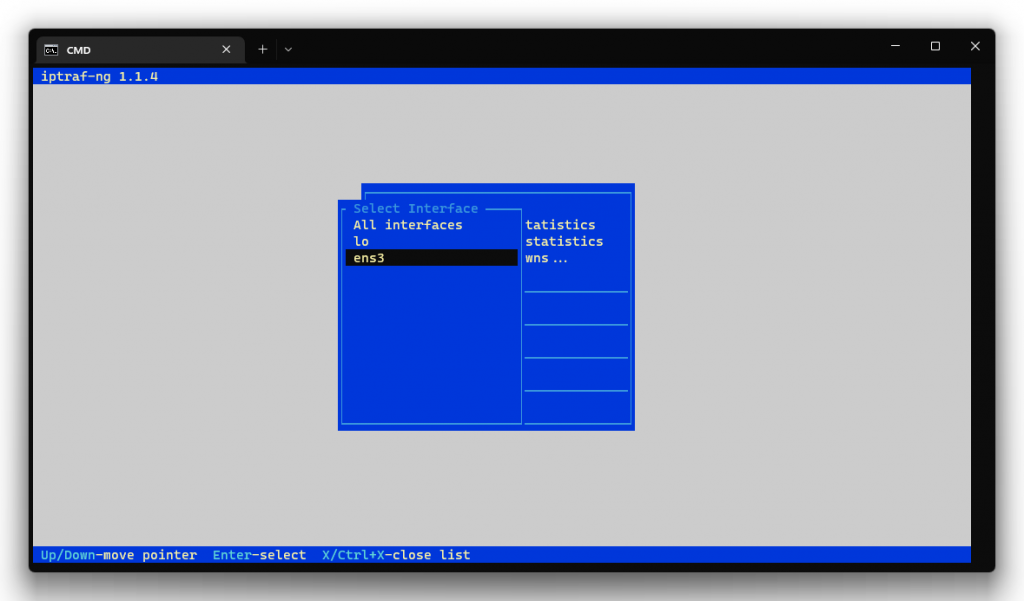
Statistics roughly look like this, here you find which addresses are communicating with your server, how many packets and how much traffic they send
For a deeper diagnosis of network operation, we also recommend that you study what the ping, arp, traceroute, mtr, tcpdump, trafshow commands are for and how they work. We will be glad if this information was useful to you!